This is yet another part in my series of blogs about molecular modelling. This blog is going to be about predicting infrared spectrum of a molecule by calculation.
Infrared (IR) spectrscopy is a routine procedure in undergrad organic labs, which helps mainly to detect the functional groups in a compound. By looking at the fingerprint region, we can also identify the compound itself, but this is not done so much nowadays (because more sophisticated techniques like NMR are available).
Calculating IR spectra of compounds is very useful. It can be used as to analyze an experimental spectrum and assign vibrational modes to them. I will use GAMESS for the calculations, and wxMacMolPlt for visualisation. (Avogadro is also used, to make the input files)
Vibrational modes and their relationship with IR spectrum
In a molecule with N atoms, the atoms can move in 3N directions (cartesian coordinates). Out of them, 6 are rotation and translation of the whole molecule, so only 3N-6 coordinates represent the atoms moving w.r.t each other (Part 2). These can be called internal coordinates. Note that there can be many choices for the internal coordinates, but as long as they are 3N-6 in number, it is a valid set of coordinates.
It turns out, that for any molecule, there is a unique set of internal coordinates such that each coordinate is independent of each other. (This means that if the energy is expressed in terms of these coordinates, there are no cross terms). These coordinates are called the normal coordinates (each normal coordinate is some linear combination of cartesian coordinates of atoms)
Vibrations happen along these normal coordinates. Some of these vibrations result in change in dipole moment, these vibrational modes can absorb IR waves and result in peaks in the IR spectrum. The vibrational modes and the change in dipole are all linked to the symmetry of the molecule. I won’t go into detail about this, but if you are interested, I recommend this book.
Calculating IR spectrum
Computing an IR spectrum with GAMESS is quite easy, because it is automatically done every time a hessian calculation is requested (either through HSSEND=.t. at the end of an optimization, or directly by RUNTYP=HESSIAN). Usually, optimization is done before hessian, because without optimization the frequencies calculated are meaningless.
We will optimize and calculate the frequencies (IR) for acetone with RHF/aug-pcseg-1. First, draw the structure with Avogadro, and then write an input file. Edit the input file to change the basis set, and also assign more memory with MWORDS=50 in $SYSTEM. A larger amount of memory (by memory I mean RAM) is required for calculating the second derivatives.
The calculation should take less than 15 minutes, after that, open the output file with wxMacMolPlt, and go to subwindow>frequencies.
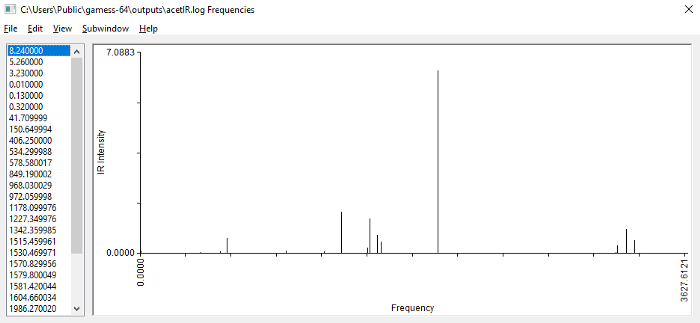
Vibrational frequencies of acetone (calculated with C2v symmetry)
The frequencies for various vibrational modes are on the left (they are actually in the units of cm-1 , which makes them wavenumbers). The IR intensity associated with each vibrational mode is also calculated by GAMESS, but it’s not displayed here. However, the spectrum plotted on the right takes into account the intensities to plot the peaks. You can click near each peak to see what it’s frequency is. Also note that the peaks are plotted as absorbance, whereas in labs, they are plotted as transmittance(i.e. turned upside down).
Click on the large peak in the middle, and you will see that it has a frequency of 1986 cm-1. If you click animate mode in the main MacMolPlt window, the normal mode of vibration that gives rise to this will be animated. This peak comes from the stretching of the C=O bond. On the right, around ~3200 cm-1, you will find vibrations from various C-H stretches. On the left, in 1200–1500 cm-1 range, there should be bending modes.
You can look at the experimental IR spectrum of acetone here. One thing that’s immediately obvious is that the IR peaks we calculated are all greatly overestimated. For example, the actual C=O stretch peak is at 1715 cm-1, while the calculated is 1986, the actual C-H stretches are around 3000 cm-1, while the calculated are ~3200 cm-1.
The main reason this happens is because the method we used, RHF/aug-pcseg-1, neglects most of the electron correlation, so it is quite inaccurate. There are also other sources of error here — 1) we calculated frequencies for just one molecule, but usually IR spectra are taken in liquid phase, where intermolecular interactions change the frequencies, 2) the frequencies are calculated using harmonic approximation (actual vibrations in molecules are anharmonic). Another thing to note is that QM calculations always give one frequency for one mode. However, in experimental IR spectra, the peaks are never a sharp line, but always broadened to some extent, due to a variety of reasons.
The main source of error can be reduced to some extent by including a method for electron correlation, such as MP2 or DFT. This will take a (much) longer time, so do it only if you have that much patience! Also the liquid environment can be appoximated by implicit solvation (such as SMD).
Running optimization and frequency calculation on acetone with B3LYP-D3(BJ)/6–31+G(d) and SMD(acetone) gives:
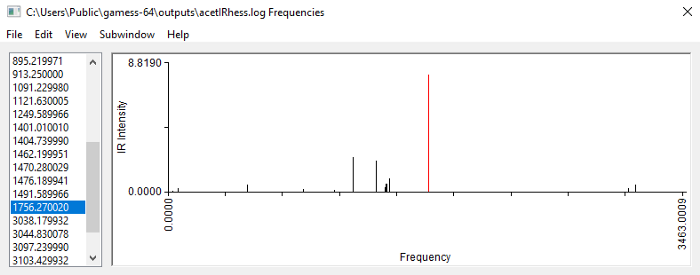
Acetone B3LYP-D3(BJ)/6–31+G(d)/SMD(acetone), no symmetry
The C=O stretch peak now comes at around 1756 cm-1, so that’s a great improvement over the previous calculation. However, it is still off by 40 cm-1 from the experimental value, and this is because we have not eliminated the other sources of error.
Due to this, often an empirical scaling factor is used, which is multiplied with the calculated frequencies, to account for the errors. The factor depends on the computational method used, and is kind of a band-aid fix. It is also possible to fix this by doing more accurate calculation that eliminates the error from harmonic approximation, but it requires more computational effort and is not usually worth it.
Plotting IR spectrum
If you are not satisfied with the line spectrum of MacMolPlt (I am not) then there is another software GaussSum, that you can use (for windows, the software comes as an installer). This software can generate IR spectra in the way it is usually printed out from actual IR spectrometers.
Open the output file with GaussSum, select Frequencies and then press the button on the right.
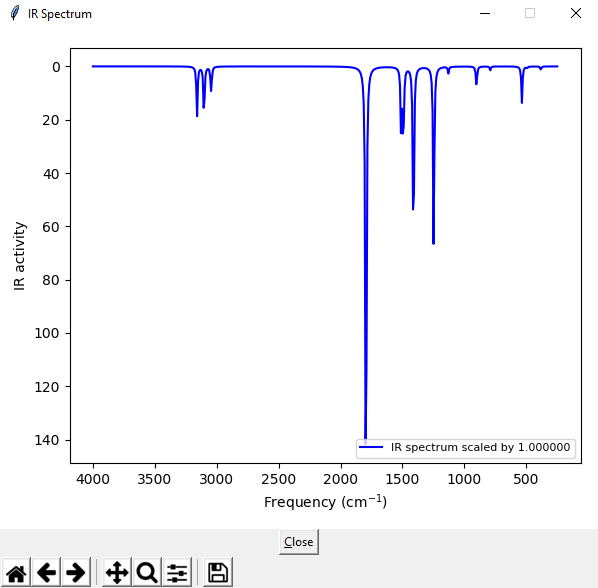
IR spectrum of acetone, B3LYP-D3(BJ)/6–31+G(d)/SMD(acetone)
This is the spectrum calculated with B3LYP. Compare it to the experimental spectrum here. There are some differences, but the strong peaks are the same in both calculated and experimental spectra.
wxMacMolPlt: https://brettbode.github.io/wxmacmolplt/
GAMESS: https://www.msg.chem.iastate.edu/gamess/
GaussSum: http://gausssum.sourceforge.net/